“Only those who will risk going too far can possibly find out how far one can go.”
T.S. Eliot
How far should you reduce or increase your (ROAS/POAS/CPA) targets?
To maximize your absolute PROFITs, you really need to test different target values in your smart bidding campaigns.
Why?
Because your targets directly influence your bids. And your bids influence the number of impressions, your ad position, the number of clicks, and ultimately your total conversion value.
This influence isn’t a linear relation though, it more or less follows a profit curve like this:
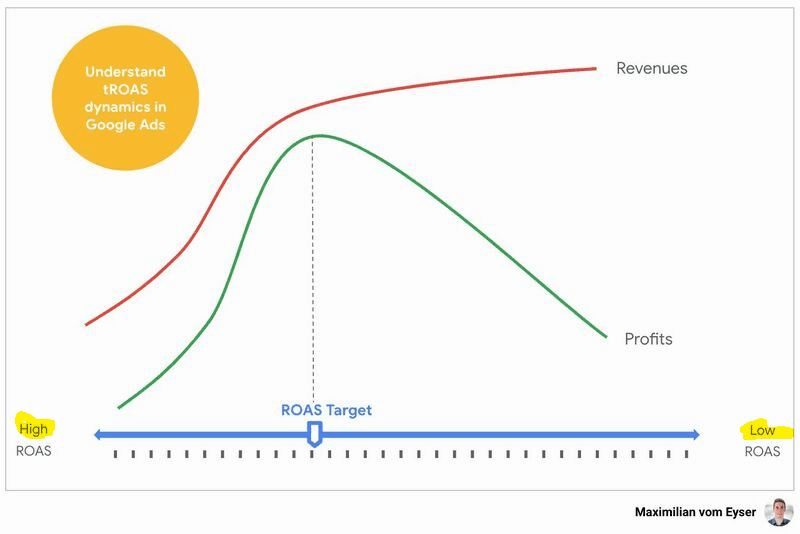
Here’s the thing: the exact shape of this curve differs per account, per campaign, and per time period.
To get to know the shape of this curve, we need to do some testing.
Here’s how I like to discover the shape of this curve for the campaigns in my account:
1. Create two versions of the same campaign (geo split, or run campaign experiment, 50-50 split)
2. Change ROAS/CPA target for the experiment (+/- 20% change compared to the original)
3. Create a custom column that reports profit to easily monitor the difference in performance from the campaign view
4. Keep this experiment running for at least 14 days, and at least until the total number of conversions of both campaigns reaches 60
5. Re-adjust the target for the campaign that showed the least profit and go back to step 4
NB: if you are not already tracking profit in your account, you can create a custom column that uses this formula to report the profit estimate. Here’s how:
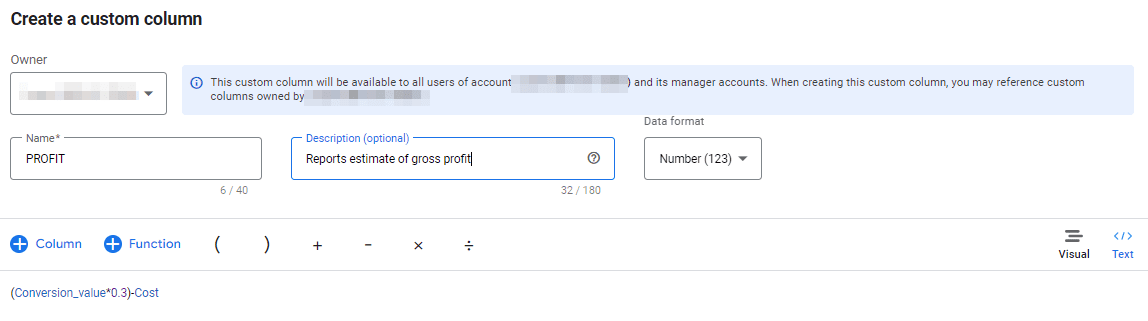
Replace 0.3 with your average profit margin.
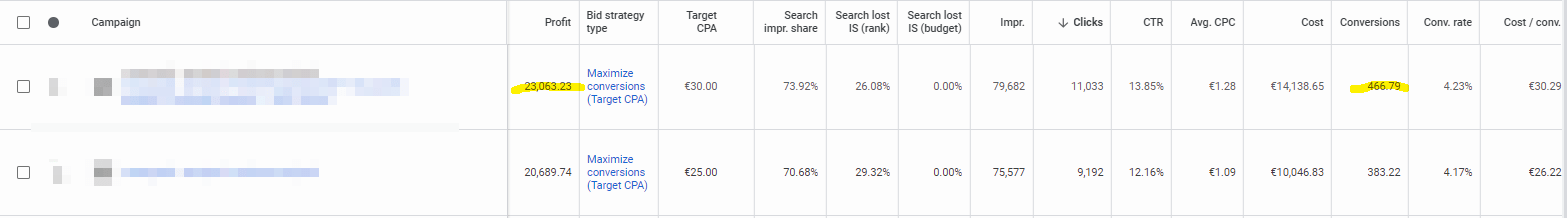
Then, this is what the result will look like:
– Nils