Heatmaps are the bomb.
They immediately point your attention to anomalies in your data when looking at large data tables.
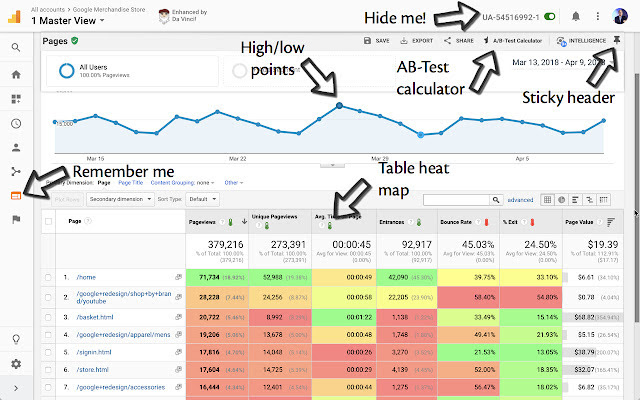
Google Analytics and Google Ads present your data in tables but unfortunately don’t offer a heat-mapped view.
This is where our friends from Supermetrics come into play. They created this nice Chrome extension to easily create the heatmap for you:
Here’s the link:
https://chrome.google.com/webstore/detail/da-vinci-tools/pekljbkpgnpphbkgjbfgiiclemodfpen
– Nils
PS: If you’re a big fan of heatmaps as well, have a look at this script from Brainlabs –> https://www.brainlabsdigital.com/marketing-library/heat-maps-script/